

Scale your Additive Manufacturing Production
How to gain the highest return on investment?
Scaling Additive Manufacturing (AM) production is an arduous task as you must take care of multiple factors before deciding on a scaling strategy.
This article is for those who would like to increase and optimize the productivity of their AM factory with minimum effort. We will describe an actual customer use case that will make the scaling process easy to follow.
The main challenge
The customer wanted to increase production by adding three EOS P 396 systems to their two existing EOS P396 machines. However, the team was unsure whether the existing post-processing machines would handle the highest throughput with a one-worker shift. The AM product remained the same, which means that the workflow and the type of equipment also remained the same. The main challenge was to optimize the additional post-processing equipment and resources to have the highest throughput while keeping the cost per part as low as possible.
We supported the customer by developing a customized production model with suitable variable input parameters. Different scenarios can be generated by varying these input parameters to check the sensitivity of the throughput and cost per part. This information guides the customer in deciding the optimized scenario with the lowest additional investment to scale the AM production.
In summary, we identified the bottlenecks in the factory. By making small changes in post-processing, we increased the output by 24%, increased the margin by 124%, increased the return on investment (ROI) by 115%, and reduced the cost per part (CPP) by 18%.
Using simulation to solve the production optimization problem
A successful business case for serial production needs an in-depth analysis of all the production parameters that impact the output and the costs. These production parameters are often related to each other in a non-linear way, and therefore it is hardly possible to optimize them using an Excel spreadsheet. On the other hand, simulation software takes all production-related complexities into account and solves the optimization problem more straightforwardly.
We at EOS use Tecnomatix Plant Simulation from Siemens and offer our service to help our customers simulate customized solutions to have a good process understanding for a make or buy decision.
We are using simulation software to simulate the AM process and the post-processing steps. A successful AM business needs to analyze the post-processing throughput and costs, sometimes making or breaking a business case. Simulation makes it easier to scrutinize the complex process chain.
Introduction to the case study
To demonstrate the benefit of discrete event simulation, we would like to introduce a customer who already has two EOS P396 and would like to scale up due to an identified growth potential. After the initial success, they decided to invest in an additional EOS system to satisfy the forecast. In addition to the AM machines, the customer already has the following post-processing equipment installed in the facility:
| Unpacking station | x1 |
| Powder management system | x1 |
| DyeMansion Powershot C | x1 |
| DyeMansion Powershot S | x1 |
| DyeMansion DM60 | x2 |
| UV treatment | x1 |
| Surface finishing | x2 |
| Drying area | x1 |
| Inspection table | x1 |
With the EOS P 396, the customer can print jobs that contain 144 parts. Two EOS P 396 can produce 426 jobs per year or 61.344 parts per year. The customer needs to produce an additional 600 jobs per year or 66,400 additional parts per year. A first calculation shows that another three EOS P 396 would be needed to reach the target, meaning a high investment for the company. Therefore, the goal of the production simulation was to figure out if the output could be achieved using the sa me amount of post-processing equipment and take all the production complexities like failures, maintenance, and worker shift models into account.
How we proceeded:
The whole layout was divided into 3 areas (see figure 1):
- AM printers
- Powder Management
- Post-Processing
The customer prefers having three regions to minimize the risk of cross contamination of powder. We first built a simulation model with the two existing EOS P 396 and then a second model with three additional EOS P 396 together with the above listed equipment. The customer uses a one worker shift from Monday to Friday. During the analysis process, we carefully adapted all kinds of variables such as consumables and operators for the production facility.
A discrete event simulation can simulate all the events that are happening at a given point in time. It considers the start time and the end time but will not consider what happens in between.
For example, let’s say you enter the ATM at 17:50 and you are out of the ATM at 17:53. The simulation shows an event at 17:50 which is start of the event and then jumps to 17:53 which is end of the event. In plant simulation the clock will jump from one scheduled event to the next one.
In the context of manufacturing, it is a part entering a machine for processing and exiting once the process is done. There can be various steps involved in processing a part (setup time, loading time, unloading time) which can all be included in the simulation. The simulation study helps increasing the throughput and utilization of the machines. It can also help determine number of workers, equipment, machines and storage size to have the best business case.
Analysis & Results of the Simulation
Optimizing the AM & Powder Management area
We started by simulating the AM area and powder management area before including the post-processing equipment. The shift model was unchanged from the original as follows:
- Shift: 1 shift (8 hours), Monday - Friday
- Build time: 20 hours.
Once the model was built, the first challenge was identifying the optimum number of workers for these two activities. We did five experiments (Exp.) and determined that one worker is enough for these two areas, as shown in Table 1. Whether we have 1 or 5 operators, the throughput remains the same (1.065 jobs per year).
| Number of Operators | Jobs produced | |
| Exp 1 | 1 | 1065 |
| Exp 2 | 2 | 1065 |
| Exp 3 | 3 | 1065 |
| Exp 4 | 4 | 1065 |
| Exp 5 | 5 | 1065 |
Table 1: No of operators for AM & Powder Management area and respective annual production
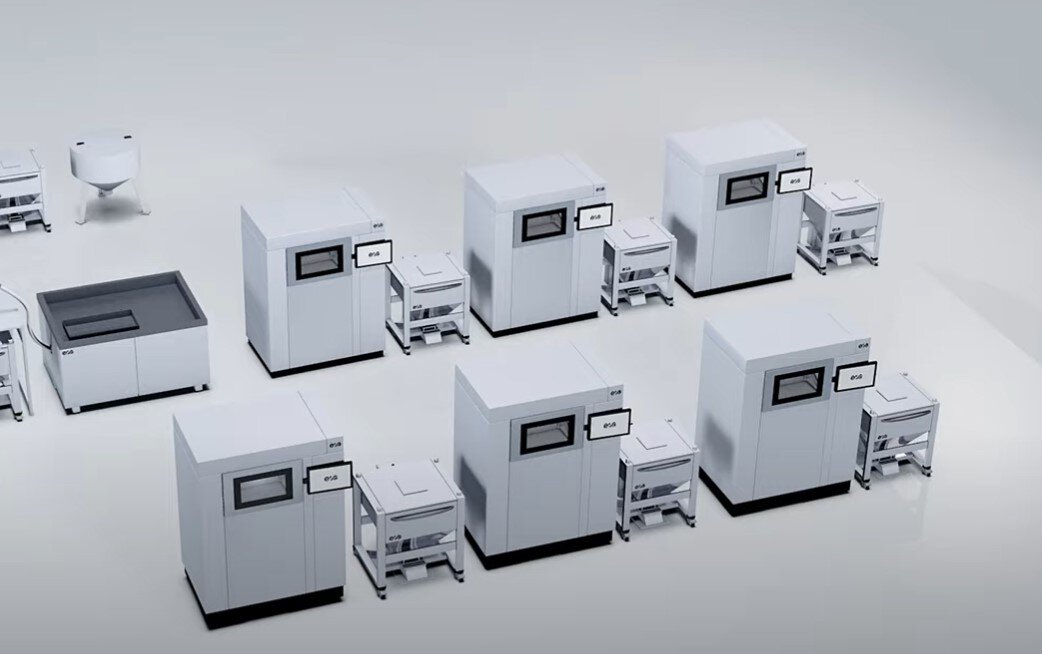
Next, we focused on optimizing the number of powder transport boxes (EOS Multi-box, see Picture 1), allowing a worker to distribute powder to the EOS machines. In ten iterations, we identified that seven EOS Multi-boxes are the optimum number to achieve a throughput of 1062 jobs per year (see Table 2). The increased production by having more than seven Multiboxes does not justify the additional costs. There is only a gain of three jobs per year (from 1062 to 1065), and the increased cost, not shown in this report, does not warrant this small production gain.
| Number of Multi-boxes | Jobs produced | |
| Exp 01 | 1 | 184 |
| Exp 02 | 2 | 367 |
| Exp 03 | 3 | 551 |
| Exp 04 | 4 | 732 |
| Exp 05 | 5 | 911 |
| Exp 06 | 6 | 983 |
| Exp 07 | 7 | 1062 |
| Exp 08 | 8 | 1064 |
| Exp 09 | 9 | 1064 |
| Exp 10 | 10 | 1065 |
Table 2: No of Multibox and the respective jobs
Optimizing the Post-Processing area:
After optimizing the AM and powder management area, the post-processing area was the next challenging task. It involved seven different process stations with ten steps:
- Part cleaning in DyeMansion* Powershot C
- Ultrasonic cleaning
- Surface finishing
- Ultrasonic cleaning
- Drying
- Surface treatment in DyeMansion* Powershot S
- UV treatment
- Coloring in DyeMansion DM60
- Surface treatment in DyeMansion* Powershot S
- UV treatment
(*DyeMansion is part of the EOS Ecosystem)
Additionally, there were a few challenges regarding the customer workflow. For example, the blasting stations (Powershot S and C) from our partner DyeMansion should only process half of the parts produced in one build (72 out of 144 parts), in other words, two lots per build. However, for all other stations such as the DyeMansion DM60 coloring system, surface finishing, drying, and so on, all jobs need to be processed, in other words, one lot per build.
Once the original model was extended to include the post-processing area, we focused on finding the optimum number of operators. Starting with the AM optimum of 1062 jobs per year, we ran five different setups with 1-5 operators. As seen in Table 3, 4 operators would be needed for the post-processing area to have considerably higher throughput than the previous number of workers. 4 additional jobs do not justify the additional cost (not shown here) of an additional operator (848 vs. 849 jobs).
| No of operators | Jobs built through AM | Jobs produced through AM + Post processing |
|
| Exp1 | 1 | 1062 | 228 |
| Exp2 | 2 | 1062 | 666 |
| Exp3 | 3 | 1062 | 787 |
| Exp4 | 4 | 1062 | 848 |
| Exp5 | 5 | 1062 | 849 |
Table 3: No of operators for Post-Processing area and respective jobs
Analysis of the base Model:
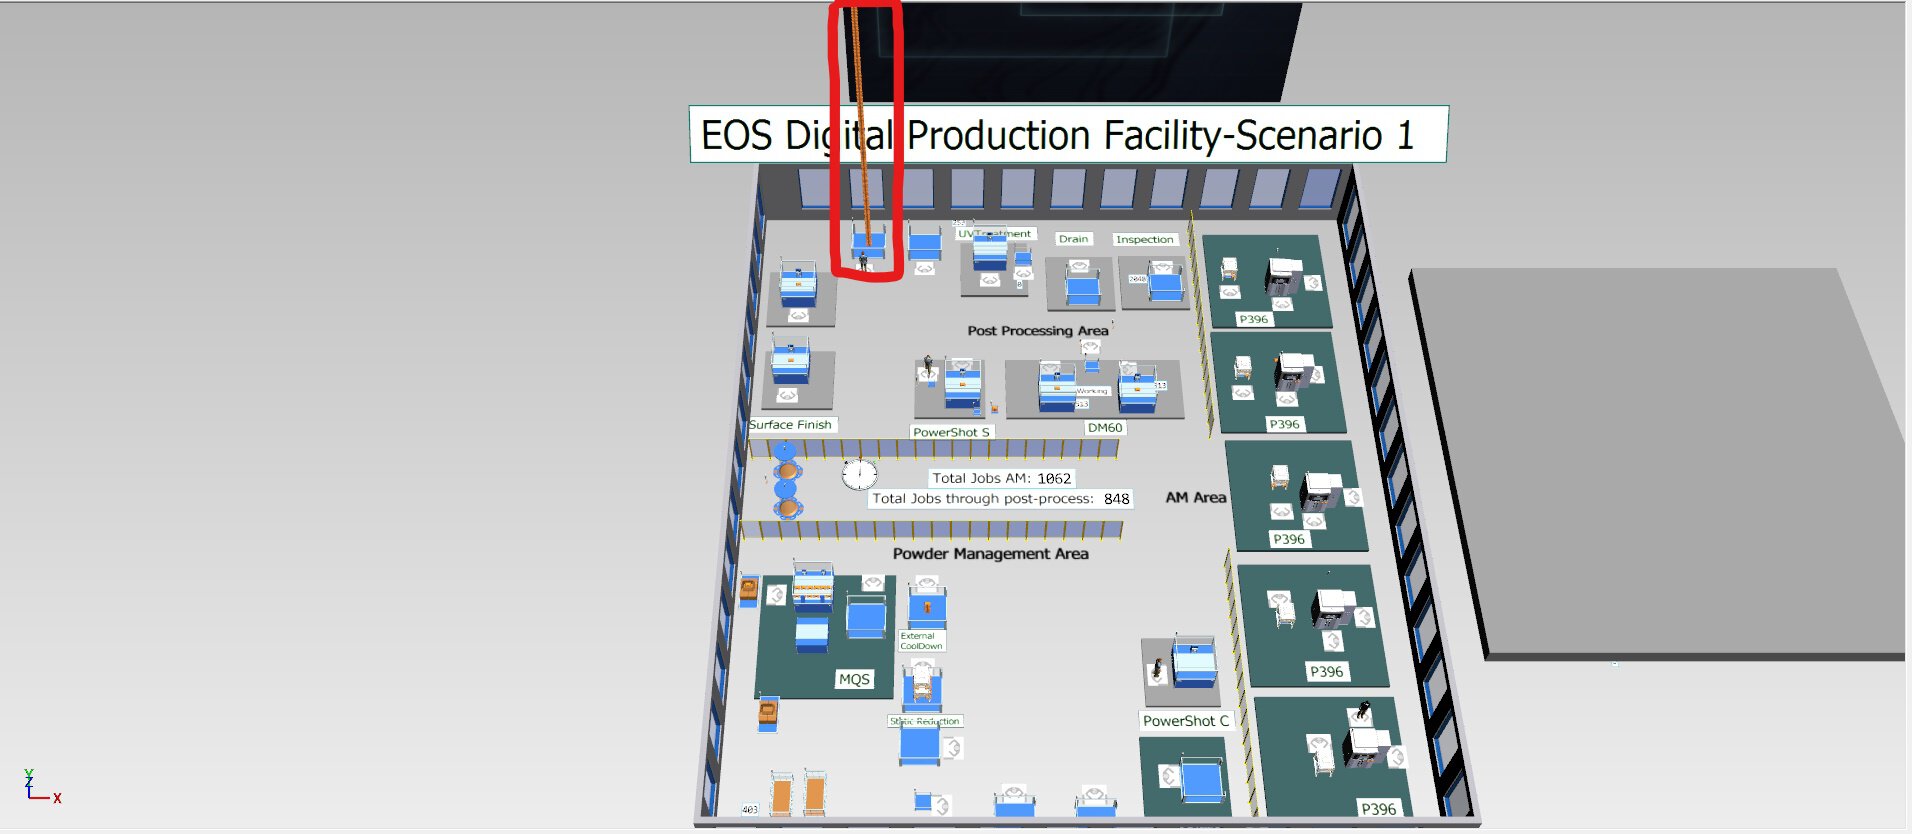
Interestingly, the base model with the AM and Powder Management area and one operator produces 1065 jobs, but with the inclusion of the post-processing area we could only achieve 848 jobs – even with the increased post processing worker number up to 4! Having a 5th worker will also not significantly increase the number of jobs through the full production line. Hence, there must be a bottleneck somewhere in the post-processing area.
The simulation model easily helped identify the bottleneck in the surface finishing area. Do you see the high pile of undone jobs (or work in process) in Figure 1?
215 jobs or 30.900 parts still need to be processed in the surface treatment area.
Optimization iteration 1:
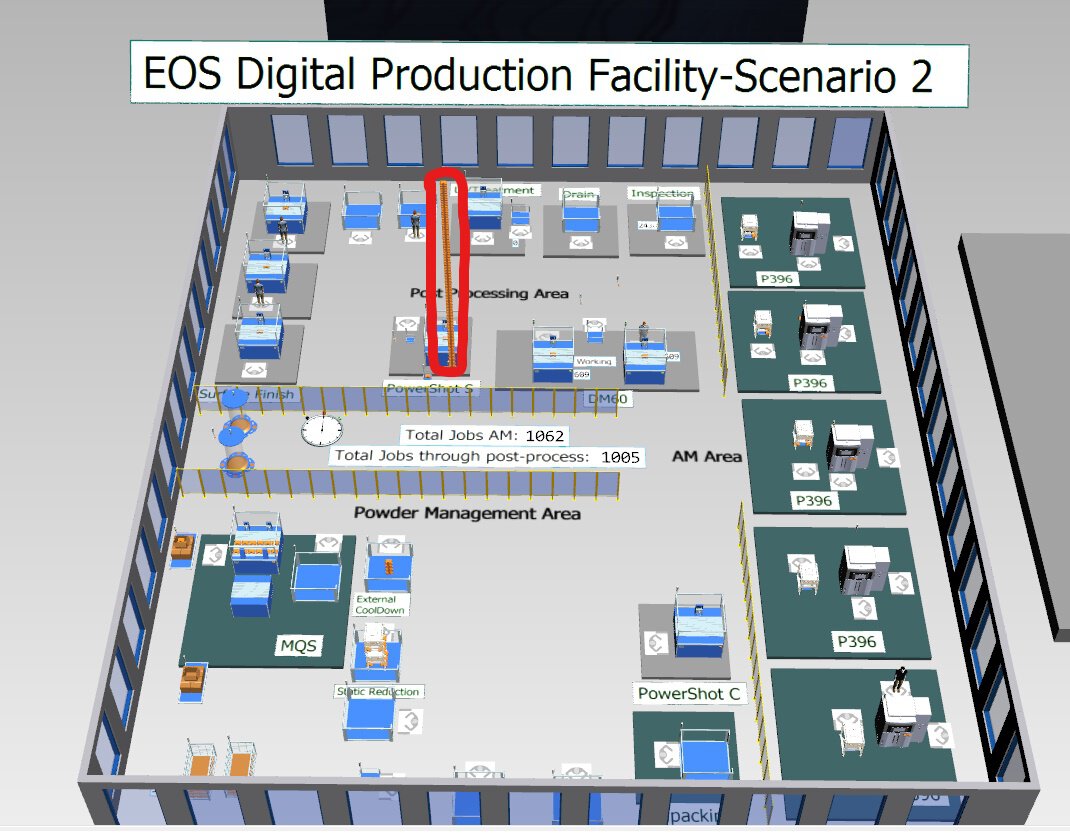
One solution to remove the bottleneck at the surface grinding equipment could be to add another surface grinding machine while keeping the same number of workers and shifts. After doing the necessary modification to the simulation model, we realized that adding another surface finishing machine did not completely remove production line bottlenecks but rather moved it to the DyeMansion* Powershot S. Luckily the size of the bottleneck reduced to 57 jobs or 8.226 parts. Figure 2 shows the new bottleneck and throughput.
The impact of this optimization is as follows:
- Utilization of machines is expected to be 46%, which, for a 5-day single shift for a 20 hour build after 9% planned & unplanned downtime and 10% part rejection, is very good
- 15% decrease of CPP
- There is an increase of 17% points in ROI due to this single change
Optimization iteration 2:
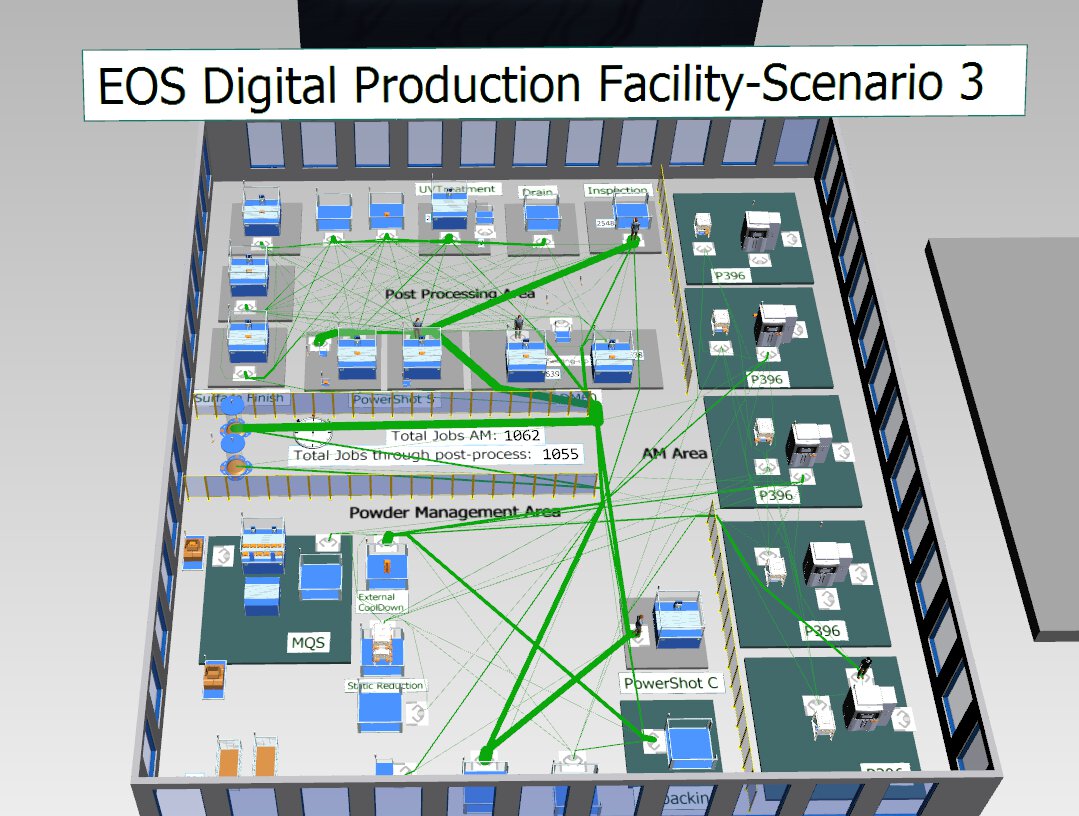
For the second iteration we focused on the new bottleneck identified in iteration 1. We added one more DyeMansion PowerShot S and this solved the bottleneck. We couldn’t detect a shift like the one from the 1st iteration to the 2nd.
In Figure 3 you can see the result. Nearly all the initially manufactured 1062 jobs completed the manufacturing process in time with only a minor capacity loss of 0,01% due to the last job in the year being processed.
The impact of this optimization is as follows:
- Additional 2% utilization of machines or total of 48%
- Additional 3% or total 18% decrease of CPP
- Additional 5% points increase in ROI due to this single change to a total of 22%
Adding the machines to have the highest throughput is only a partially optimized solution for serial production. The other important factors are the cost of adding machines and operators to determine if they have a positive impact on cost per part.
Conclusion
The key message here is that scaling and optimizing your AM production strategy can be a complicated task. It is a unique challenge, tailored to a specific layout with different key parameters for each scenario. Not analyzing and taking your strategy into account can lead to incorrect conclusions. With our simulation expertise and 30 years of AM experience we can make a winning scaling strategy for you to achieve the highest machine utilization and lowest cost per part.

